
CALL CINDY TODAY · 850-428-2306

Real Estate Prospective From an Appraiser
Tom Marr • Jul 08, 2023
I have stated for many years there is no such animal as “what is the market doing”, as there are many sub-markets, often increasing or decreasing at differing rates.
I consider there to be at least five sub-markets:Detached homes generally used as personal residences or rentals; Condominiums, generally used for short term rentals; Vacant residential land; Commercial properties; and Commercial land.
Over the past ten years, I consider there to be a sixth category which is wide variety of detached homes used for seasonal rental purposes, which have the characteristics of condominiums regarding usage.
Also, location will make a difference. In the FWB market, the consistent inventory of service members with their large variable Housing Allowance (VHA) influences typical FWB homes to feature a short time on the market (DOM) and to sell near list price with a very high list to sales price ratio.
In contrast, second homes in the 30A corridor feature larger inventories, longer days on market and selling prices from 4% to 5% less than list price.
In the following pages, I will illustrate several detached home markets and make comments. Note that I have divided sales into the past year and the past six months (half a year). When I refer to the ‘first half’, I am mentally subtracting the half year from the whole year to arrive at the first half sales volume.
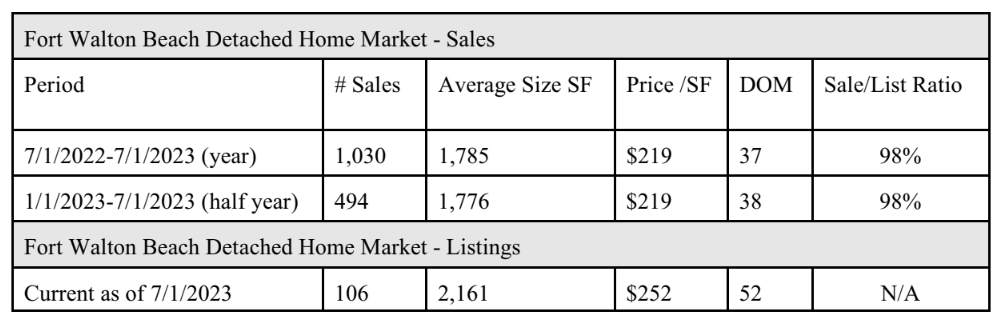
In the very stable FWB market, the DOM is low and the list to sales price ratio is very high. The first half sales volume was 536 and the second half sales volume was 494, generally consistent.
Also note that the average selling price in both six month increments was the same $219 per SF.
The DOM and the list to sales price ratio is virtually similar.
Also, note the few listings. There is about a 10-1 ratio between annual sales and active listings. This is an approximate 1.5 months of inventory. It does not surprise me that the average size of the active listings is much higher than the average size of the sales. Larger homes tend to linger longer as the gross listing price is higher. The average list price is 15% higher than the average selling price, per SF.
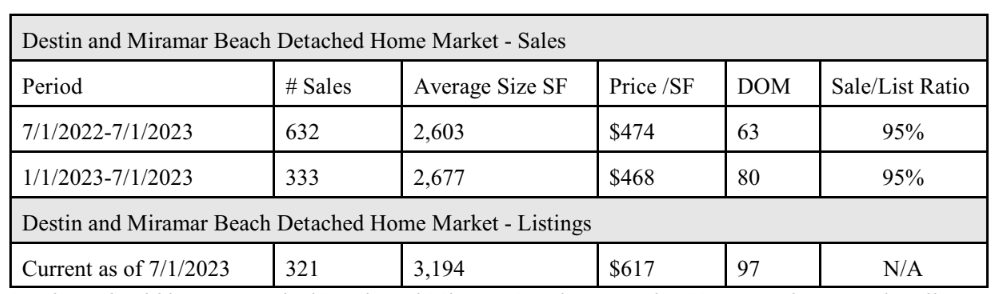
I perhaps should have researched Destin and Miramar Beach separately. However, they are primarily an owner occupied area with a higher density of seasonal rentals than the FWB market.
Here we see again see similar sales volume as 299 homes sold in the first half of the year and 333 homes sold in the second half of the year. Both selling prices and the lesy to sales price ratio were virtually the same. The days on market increased slightly.
There are 321 active listings, which means there is a six month inventory based on the 632 sales. I note that 126 of the 321 listings are at, or over, $2,000,000.
I also note the average size of the listings at 3,194 SF, much larger than the average size of the sales from 2,603 to 2,677 SF. These larger sizes, and consequently higher gross list prices as well as the $617 per SF average list price, an approximate 31% higher than the average selling prices, contribute to the 97 days on market, and counting.
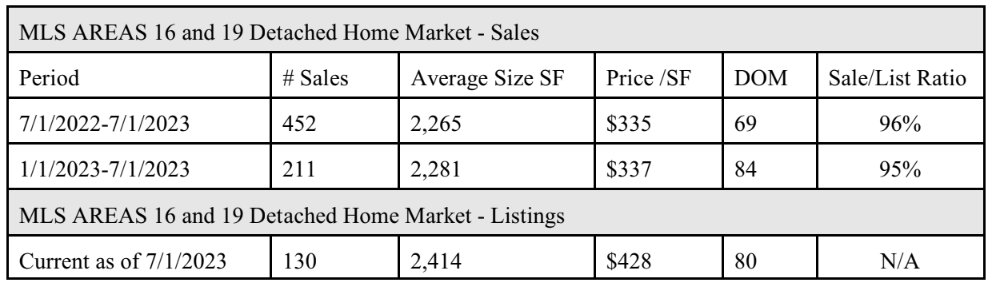
The MLS 16/19 areas are primarily owner occupied and this contributes to the stability of the data.
There were 241 sales in the first half of the year and 211 in the second half, relatively consistent. The average per SF selling price and the list to sales price ratio were consistent in both periods. The average days on market increased from the first half of the year to the second half.
There are 130 active listings, suggesting an approximate 4 months of inventory. I note that the average size of the listings is relatively consistent with the average size of the sales. I attribute this to the fact that many/most of the homes in these areas were constructed in the past 10 years and builders in this market know to build 2,200 - 2,400 SF, three to four bedrooms and 2-3 bath homes or some close derivative.
I do note the very aggressive $428 list price per SF of the active listings. This is 27% higher than the
average of the selling prices.

The MLS 17 area is primarily owner occupied, however, there is a larger percentage of seasonal rentals as compared to MLS Areas 16 and 19, or FWB.
There were 161 sales in the first half of the year and 140 sales in the second half of the year. The average selling price and the average list to sales price ratio are consistent.
Again, the DOM is longer in the second half of the year.
There were 220 active listings, indicating an approximate 8 months of inventory. Also note the 117 DOM for the listings, the first time we have exceeded 100 DOM. The average list price of $784 per SF is 21% higher than the selling prices of $642 to $645 per SF.
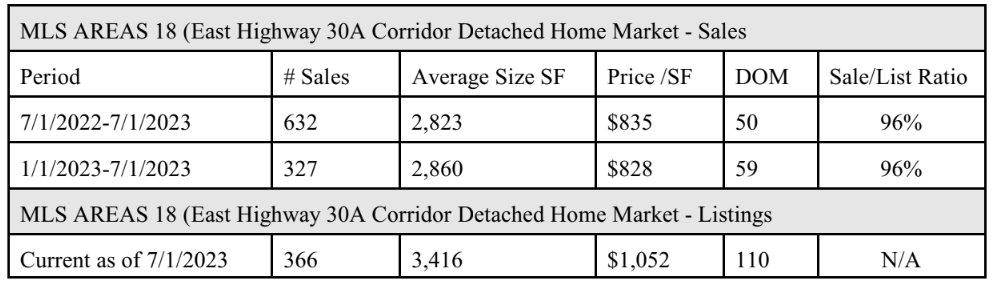
I must admit that the data for MLS Area 18 was much better than I would have projected.
There were 305 sales in the first half of the year and 327 sales in the second half of the year.
The average sales price per SF and the average list to sales price ratio were consistent. The DOM increased by 20%.
There were 336 active listings, indicating an approximate 7 months of inventory. Also note the 110 DOM for the listings, the second time we have exceeded 100 DOM. The average list price of $1,052 per SF is 26% higher than the selling prices of $828 to 835 per SF.
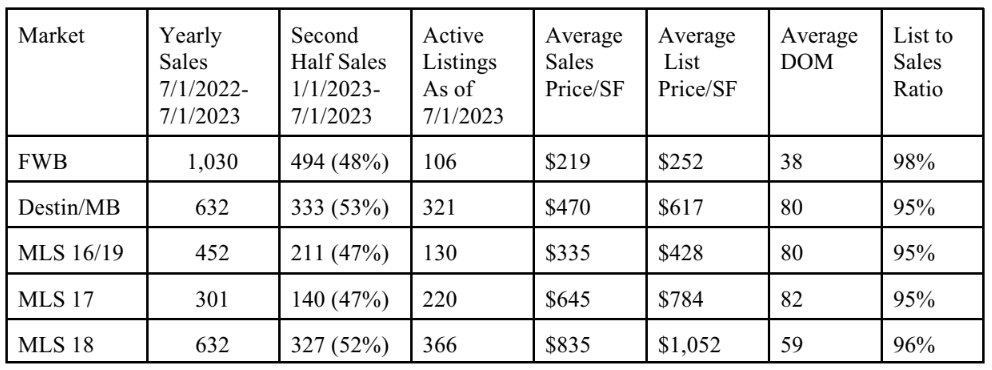
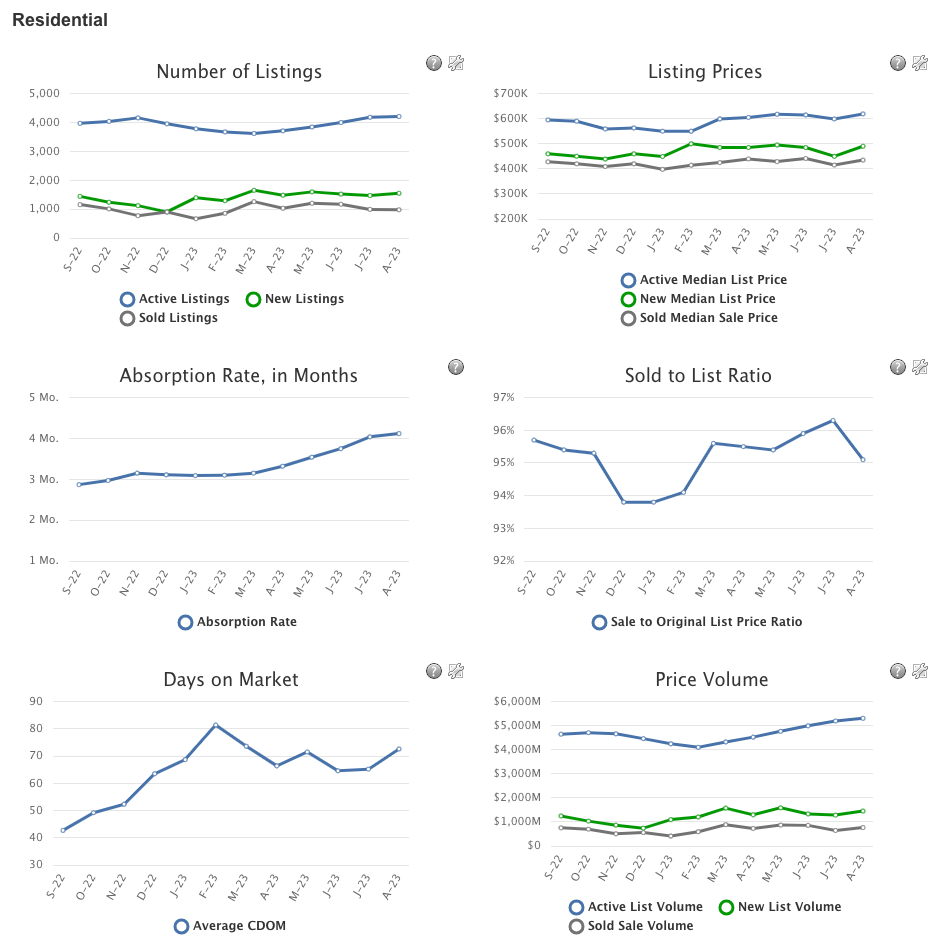
RECAPITULATION OF DATA
The following table provides a one page snapshot of the previous pages.
Summary
I wrote this short analysis after reading an article in REALTOR magazine stating that sales volume nationally was down 27% from a year to year analysis, and that the average selling price was down 1.7%.
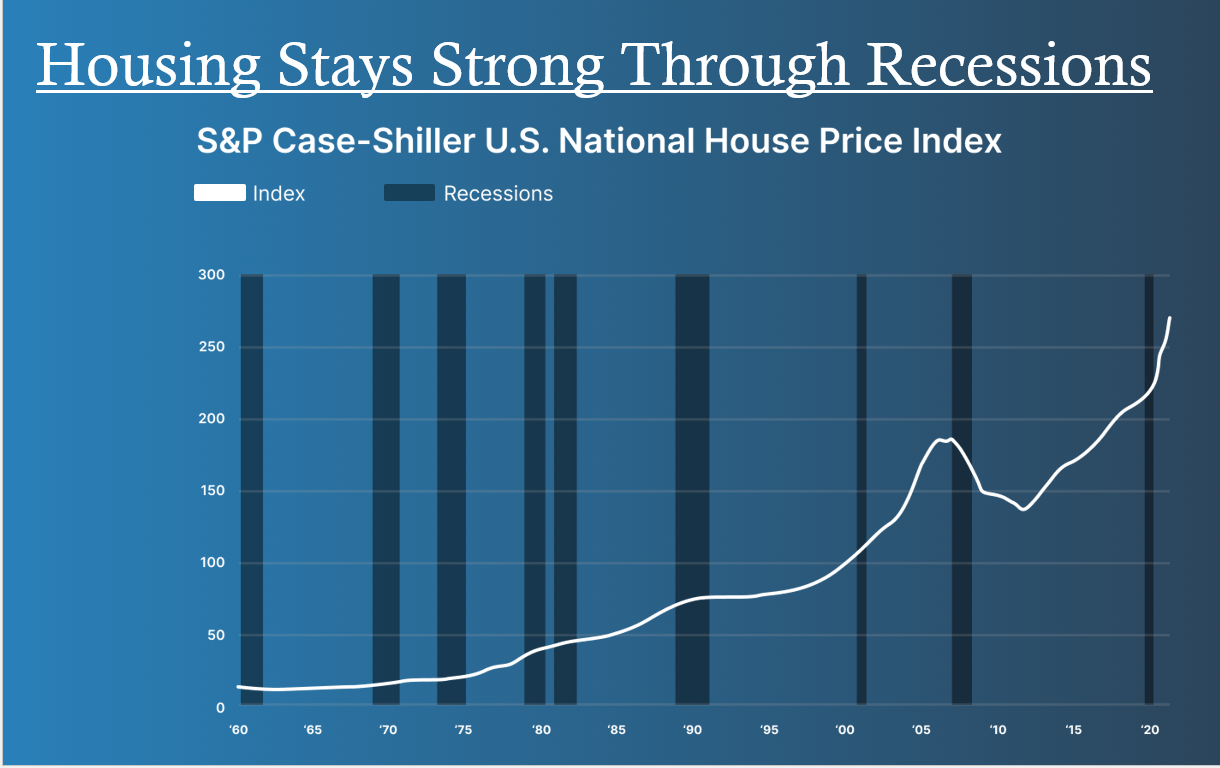
I am frequently asked by many people, to include some realtors, as to what is my perspective of the market.
I must first admit that I was wrong on or about June 1, 2022, when I thought that the increasing interest rates would badly damage the market. The date presented above indicates that this has not yet occurred nationally, nor in the local detached home market.
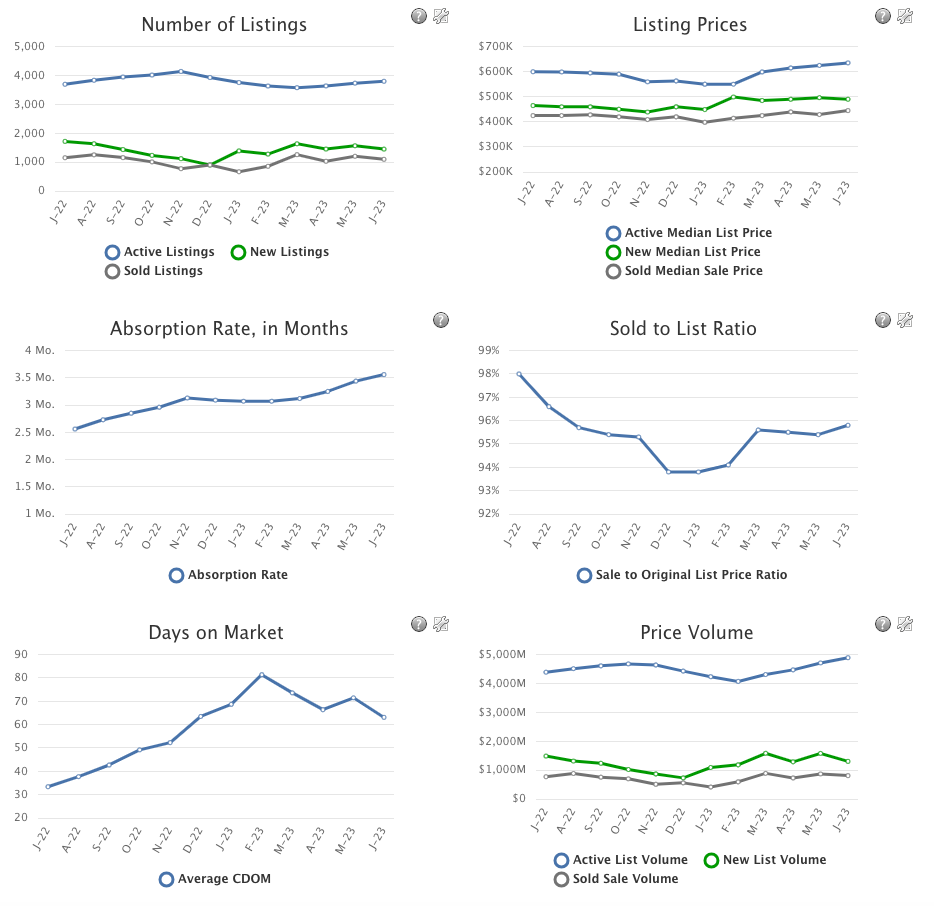
Observations
In two of the five markets (Destin and MLS 18) there were more sales in the second half of the year than in the first half of the year. In the other three markets there were 47%, 47% and 48% the number of sales as occurred in the whole year. The aggregate annual sales was 3,047 sales and the second half aggregate sales was 1,505 sales. Dividing 1,505 sales by 3,047 sales results in a percentage of 49.4%. This strongly suggests a stability regarding sales volume.
To date the DOM is strong, but in all five markets, the active listing DOM already exceeds the sales DOM.
The list to sales price ratio is also strong and consistent.
In every market, active listings average a larger size than do sales. I would be concerned about this as the national economy declines. Buyers will purchase what is functional, at the lowest price. Thus, a four bedroom/two/three bath house of 2,000 SF at say $600,000 will sell much quicker than a four bedroom/two/three bath house of 3,000 SF at $850,000, all other considerations equal.
The average list price is higher than the average selling price in all five markets. However, this is typical unless the market is in a steep decline as was the case over 2007 to 2009.
What Does the data mean?
While some people may think otherwise, appraisers do not get a crystal ball when they get certified.
The best I can do is take a guess and I already admitted that I was too pessimistic on June 1, 2022. However, here are some thoughts.
There should be some consideration of the national decrease in sales on a year to year comparison. I did not perform a year to year analysis, but rather a six month to six month analysis. Thus, I am to some degree comparing apples to oranges. But my experience makes me confident that a six month to six month comparison will yield adequate data for analysis.
As compared to the national average of 27% less sales, the local data indicates 1,542 sales in the first half of the year and 1,505 sales in the second half of the year, or roughly 49.4% sales in the second period. This suggests less than a 1% decrease in sales volume and market wide stability of sales volume. To maintain or increase this volume will require some of the inventory as of July 1, 2023 to be absorbed as well as new listings being exposed to the market. Exposing listings at sane pricing will help.
The ongoing red state versus blue state controversy will probably continue to introduce out of the area buyers to the market. I would think that most of those who want to come and can afford to come has already occurred, but the best option are baby boomers who are now retiring and do not have employment or young children holding them back. Baby boomers range from 1946 to 1963 age ranges. A baby boomer born in 1955 is now 68 and primed to move. It appears there is an eight year supply of
baby boomers on the horizon.
I note that some local organization, perhaps the TDC, indicated tourism was off 20% this year as compared to last year. Conversations with waitresses and charter boat captains support this comment. This will be a factor for owners who are using their homes for seasonal rentals and for locals who are paying high rent into the teeth of decreasing income. While probable seasonal rental income is decreasing, expenses such as ad valorem taxes and insurance are increasing. I would note that this particular segment of the overall market is small, perhaps only 5%.
To sum this up, recent history suggests that, at worst, the local market will meander sideways for several months and perhaps a few years. However, I project that a decrease in interest rates to say 4% will trigger many active listings as there are many owners out there with a 3% loan and a lot of actual or perceived equity, who want to cash out. To do that now requires a cash buyer as a buyer who needs to get a 6-7% loan will do the math and offer less to make up for the interest difference in the payment.
Finally, this market is different from the 2005 to 2010 market debacle as lenders have been more selective about lending criteria and down payments. There is no doubt there will be some foreclosures, however, the abyss from 2005 to 2010 will not re-occur.
Share
Tweet
Share
Mail
Real Estate Happenings
18 Mar, 2024
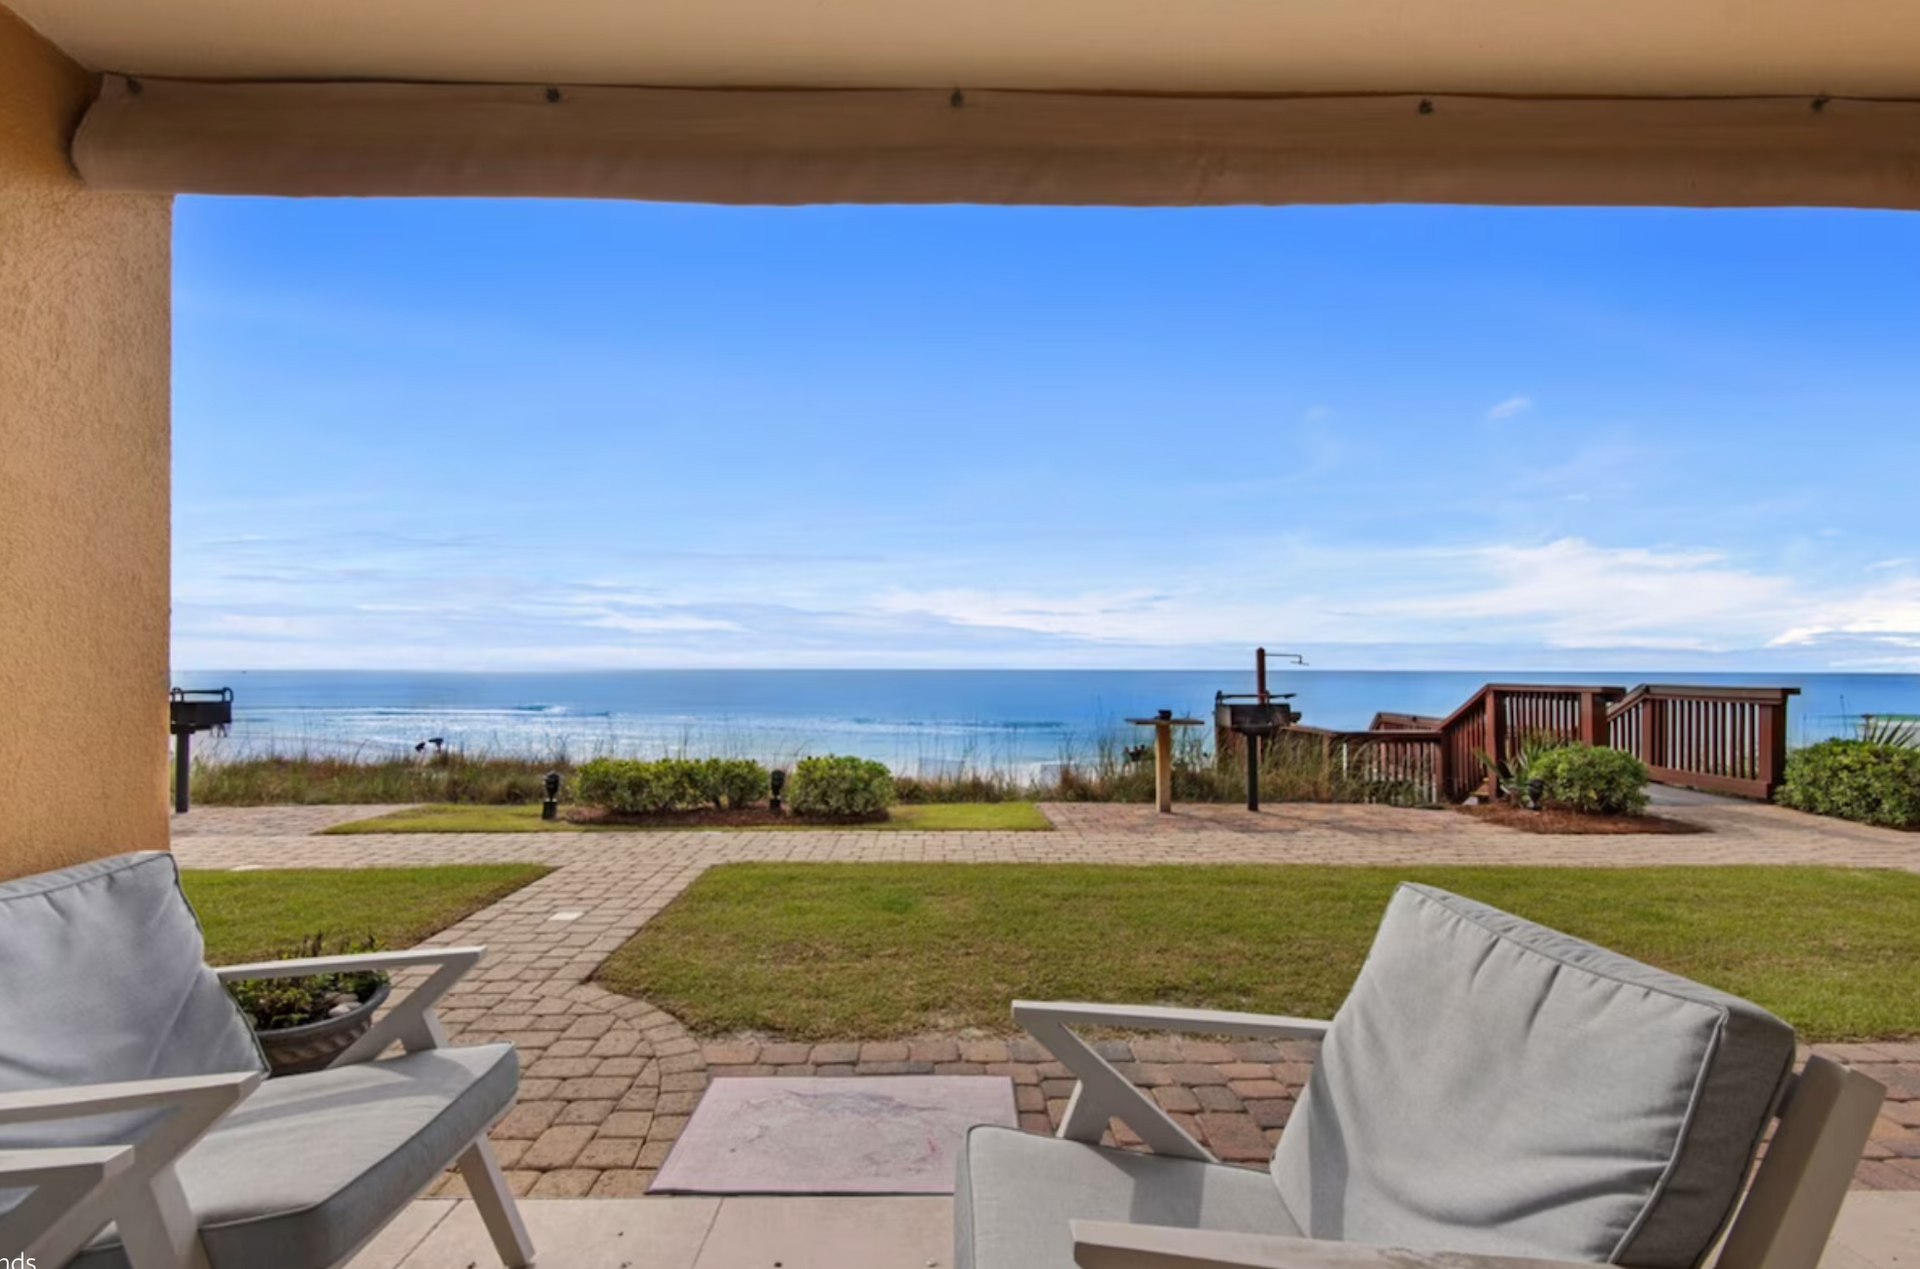
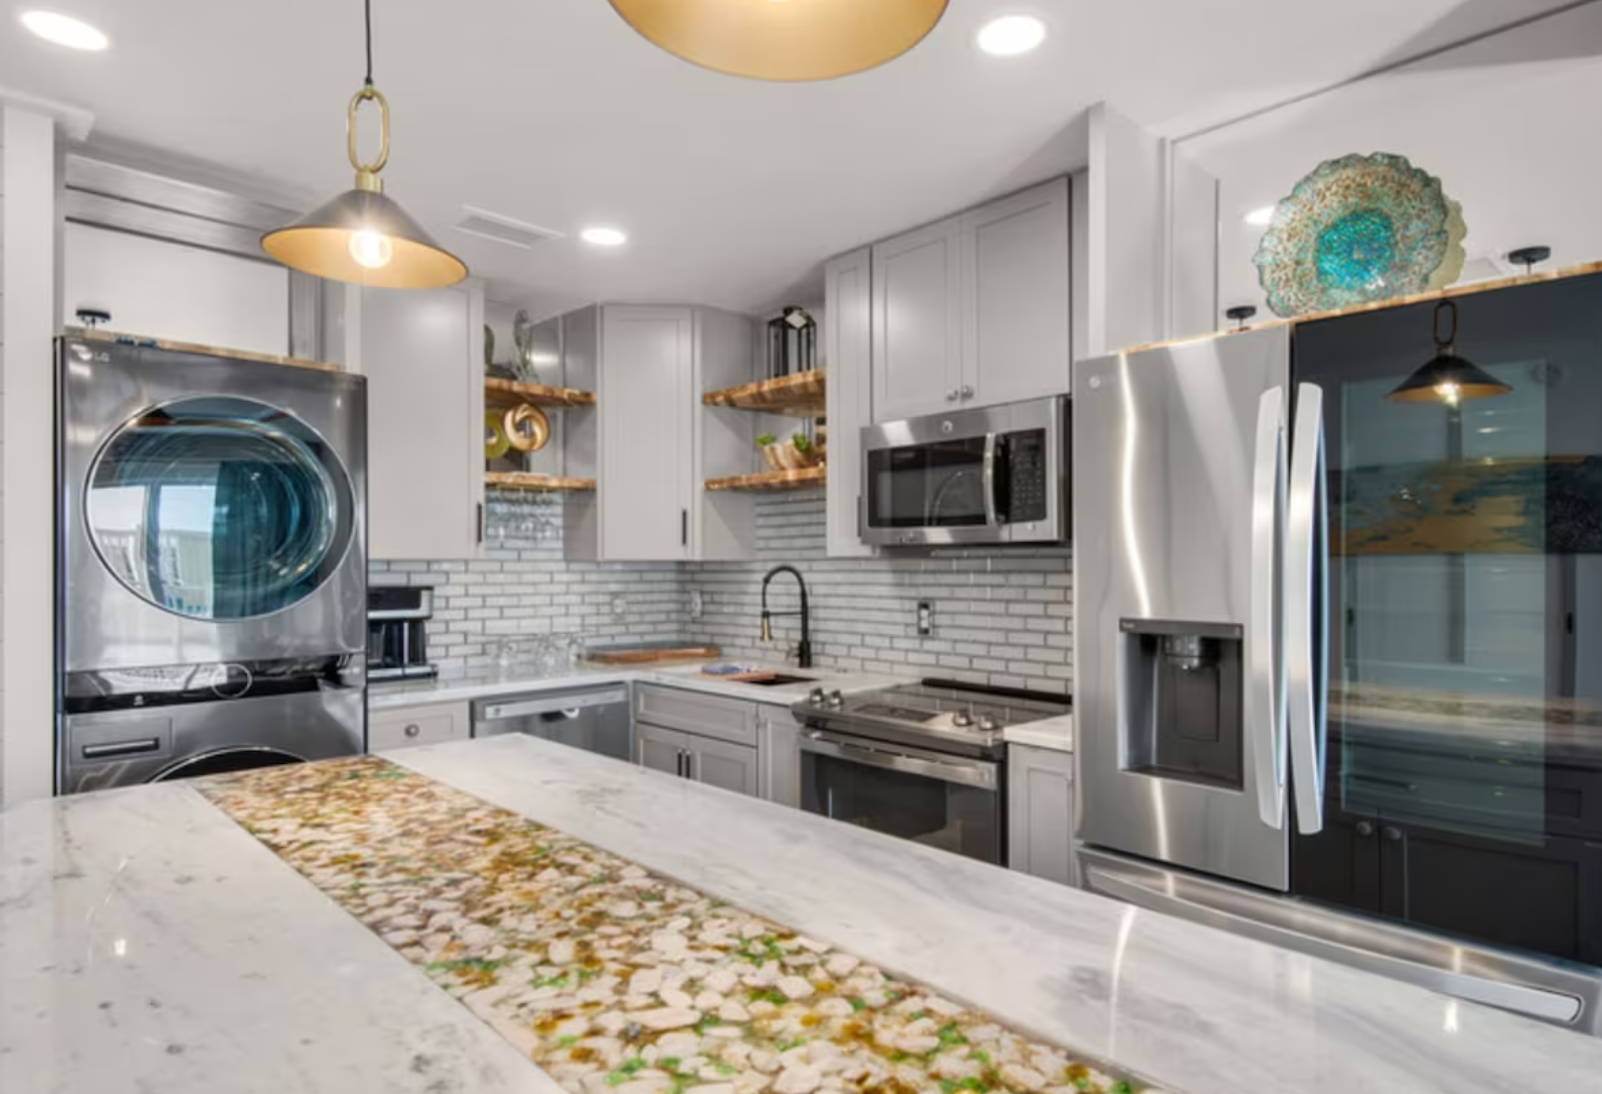
Schedule a tour today! Cindy Blanton | (850) 428-2306 | cindyblantonsells@gmail.com Coral Reef 6 | 1 Bedroom | 1.5 Bathrooms | Sleeps 8 | ±820 SF | $845,000 This first floor, one bedroom condo at Coral Reef Club is renovated into a modern second home. The kitchen is crisp and elegant with white cabinets, countertops, and appliances adorned with gold fixtures and handles. Interior and under cabinet lighting, and a bar area with wine chiller serve as a functional and aesthetically pleasing addition. Watch the waves from your kitchen and living area, amazing unobstructed Gulf views! The ensuite bedroom includes a king size bed. The bathroom is well sized with a privacy door to the shower and includes a washer and dryer. Hall bunks, a queen sofa bed, and a queen air mattress, bring the number of guests to 8. Excellent short term rental opportunity. First floor Gulf front condo located at the Coral Reef Club in the Crystal Beach neighborhood of Destin, across from the Henderson Beach Resort. No stairs, no elevators, just walk out your back door to your private patio, green space, and the beautiful beach. Centrally located close to the Destin Commons, Henderson Beach State Park, Publix, and more. Projected rental income of $110,000+, enjoy as a permanent or part time resident! Buyer to confirm all details. Schedule a tour today! Cindy Blanton | (850) 428-2306 | cindyblantonsells@gmail.com
12 Mar, 2024
Schedule a tour today! Cindy Blanton | (850) 428-2306 | cindyblantonsells@gmail.com Windancer 103 | 1 Bedroom | 2 Bathrooms | Sleeps 8 | ±806 SF | $845,000 162 Windancer Ln Unit 103, Miramar Beach, FL 32550 Welcome to this beautifully renovated first floor beachfront condo located in Miramar Beach Florida at the Windancer Condominium. Windancer is intimate in size with only 4 stories and 48 condos. Walk out to a private patio facing the pool and Emerald Green waters of the Gulf of Mexico. No elevators, stairs, or road to cross - the beach is your backyard and playground. This condominium at Windancer is the only first level condo with two sets of bunk beds - one in the hall and one over the primary bed. Sleeping up to eight people, this is a great rental opportunity! Sold with modern furnishings. Centrally located near the Silver Sands Outlet Mall, Chick-fil-A, and Winn-Dixie are directly across the street, and dozens of restaurants are within a few minutes drive. Buyer to confirm all details. Schedule a tour today! Cindy Blanton | (850) 428-2306 | cindyblantonsells@gmail.com

10 Oct, 2023
Destin, Florida, often referred to as the "Emerald Coast," is a place of pure enchantment. With its sugar-white sandy beaches, crystal-clear emerald waters, and a vibrant coastal community, it's no wonder that buying real estate in Destin has become a dream for many. Whether you're looking for a vacation home, a retirement destination, or a sound investment, Destin offers a slice of paradise that's hard to resist. The Allure of Destin: Nestled along the stunning Gulf of Mexico, Destin's charm is undeniable. This coastal town is renowned for its natural beauty, family-friendly atmosphere, and a wide range of recreational activities. With its rich maritime heritage and an abundance of marine life, Destin is a destination where every day feels like a beach holiday.
22 Sep, 2023
Owning vacation rental condos and homes creates memories as well as rental income.

20 Jul, 2023
OKALOOSA ISLAND — One of the last vacant Gulf-front parcels on Okaloosa Island is being developed for a six-story, 47-unit condominium project. Officials from Fort Walton Beach-based ResortQuest Real Estate recently celebrated the ground breaking for the future gated development called blu, which is on a little more than 2-acre site at 856 Scallop Court. The property overlooks 300 feet of beachfront and is bounded by Okaloosa County beach access No. 6 and Islander Beach Resort and Condominiums to the east and Sunset Cottages and Island Sands Condominiums to the west. According to Zandra Wolfgram, spokeswoman for ResortQuest Real Estate by Wyndham Vacation Rentals’ Gulf region, blu is the first residential condominium community to be built on Okaloosa Island in a decade. The estimated $40 million project is anticipated to be completed by the spring or summer of 2019, said Cindy Blanton, one of the development's listing agents from ResortQuest Real Estate. The property will feature three- and four-bedroom units, ranging from 1,837-2,203 square feet and with pricing from the upper $700,000s. More than half of the units have already been sold. Blu also will include a covered parking area, a fitness center, two Gulf-front pools and a jetted hot tub. "The majority of the buyers are existing owners, many of whom are multiple-property owners of second homes or vacation rentals on Okaloosa Island," Blanton said Monday. "The excitement of blu had attracted interest from owners from throughout the Southeast who are typically just a day’s drive to our beautiful beafchs. They are already invested in Fort Walton Beach, Destin, Miramar Beach and the 30A area and are eager to own new construction directly on the Gulf of Mexico." The project’s developers are Crossgate Partners LLC of Suwanne, Georgia and Olson Land Partners LLC of Destin, and the general contractor is Adventure Development Inc. of Destin. "With its close proximity to Destin and nearby restaurants and attractions, the value in developing this land was clear to us," Crossgate Partners Managing Partner Randy Moore said in a news release. "While the building and grounds will be aesthetically beautiful and offer exceptional amenities, the solid concrete and steel construction will help drive value in the future for interested buyers. We designed the development around the growing market demand with something that’s unique in price, size and style."
SCENIC REAL ESTATE
We love where we live and know you will, too, whether your goal is to raise a family in our beautiful community or purchase a vacation retreat to hand down for generations. We are committed to providing an exceptional experience while executing your real estate goals.
